Notes and Explanations
Contents
A note about terms
- A "pilot flight" is a single performance by one pilot. - A "flight program" is a group of performances from multiple pilots of the same category, one each, under the same set of rules. Sometimes we just say "flight", and that can refer to either a pilot flight or a flight program. To be clear, in the following, we've tried to use the two word designator unless it's crystal clear from context which we mean. A "category" is a group of flight programs flown by a group of pilots. It is the largest unit of competition for a contest. Pilots compete in individual flight programs and in categories. There are multiple categories at a contest. The categories generally differ by difficulty and have category-specific rules or limitations.Scoring Related Articles
- Just How Good is IAC Judging
- Article in the April, 2012 issue of IAC Sport Aerobatics describes use of this data to evaluate the quality of judging in IAC.
- Interpreting Flight Results
- Article in the July, 2012 issue of IAC Sport Aerobatics describes how judges and pilots can use this data to improve their performances.
- Throwing Away High and Low
- Article in the September, 2012 issue of IAC Sport Aerobatics debunks a sometimes suggested method for gaining unbiased results from judge scores.
- A Case for Eliminating the Manipulation of Zero as a Score
- Article in the September, 2012 issue of IAC Sport Aerobatics makes a case for eliminating the practice of averaging minority zeros and zeroing minority grades.
Category Results on the Contest pages
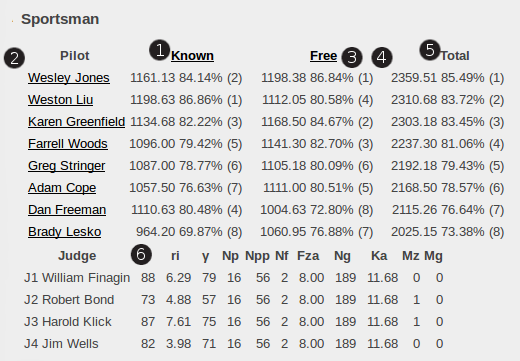
The contest pages display results for each category flown in the contest. The results show each pilot in rank order of overall standing and each judge who graded one or more flight programs of the category.
The pilot results columns show scores and rankings for each flight flown in the category, and the overall score and rank. Each row lists flight program and overall results for a single pilot.
A star ★ to the left of the pilot name means that the performance qualifies for an IAC stars achievement award.
The judge results metrics show rollups for all flights judged in the category.
- Each link at the top of the flight program column leads to a report detailing scores from each judge for each pilot on the flight program.
- Each link in the pilot column leads to the scoring detail for all flight programs flown by the pilot at the contest.
- Percentage numbers show the percent of possible points earned by the pilot for the flight, after penalties.
- Rank numbers show the pilot rank for the flight after penalties. The rank is the count of pilots who did better, plus one. (A rank value of one is the best rank, meaning no-one else did better.)
- The Total column shows the total points, percent of total possible points, and rank for each pilot in the category.
- See the judge metrics explanations for further notes about the numbers in the columns next to the judge names.
Flight results
The flight results show how pilots of one flight program at one contest measured-up in front of one judging line. It shows rankings given the pilots by each judge, penalties, and points before and after penalties.
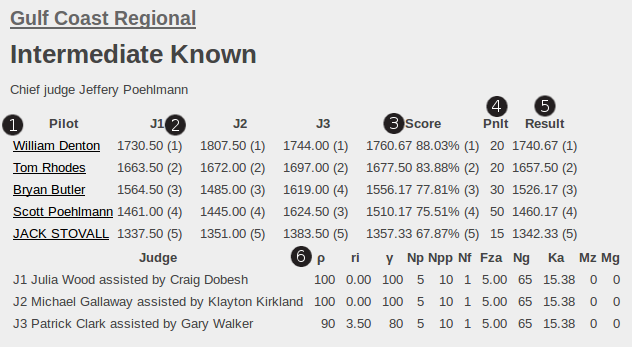
- Each link in the pilot column leads to the scoring detail for all flights flown by the pilot at the contest.
- The judge columns show how each judge scored and ranked each pilot. The rank numbers in parentheses show how the judge ranked each pilot relative to the other pilots before penalties.
- The Score column shows the average of points awarded by the judges. The percentages are of maximum possible points available on the flight. The ranks represent the rankings of the judges before application of penalties. These are the ranks used to measure how closely each judge ranked each pilot relative to the overall ranking.
- The Pnlt column shows the number of penalty points earned by the pilot on the flight.
- The Result column shows the pilot rank and number of points earned after subtracting penalties from the average score given by the judges.
- See the judge metrics explanations for further notes about the numbers in the columns next to the judge names.
Grades
The details for a pilot show every grade from every judge for every flight flown by one pilot at one contest.
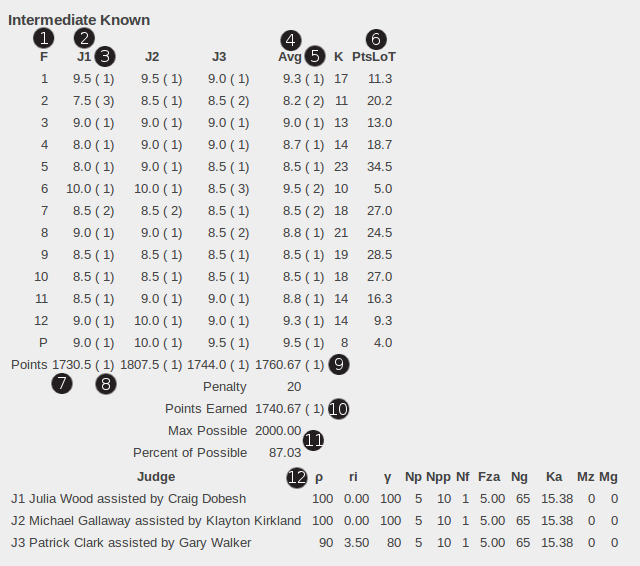
- The F column shows the figure number, 'P' for Presentation.
- The individual judge columns show the grade given by each judge for each figure.
- When every pilot has flown the same figure, the numbers in parentheses show how each judge ranked the pilot on each figure.
- The Avg column shows the average of the judges' grades for each figure.
- When every pilot has flown the same figure, the numbers in paretheses show how the pilot ranked relative to the other pilots on each individual figure. Use this to find figures flown less well than other pilots.
- The number of points left on the table, based on the K value and average score. The pilot would have earned this many more points if all judges had awarded a ten grade. Use this to find figures where improvement would give the most point benefit.
- The total number of points awarded by the judge to the pilot.
- The rank number in parentheses is the number of pilots who received a higher score from the judge, plus one-- '(1)' means first place from that judge.
- The average of points awarded by the judges. The rank number in paretheses represents the ranking before penalties.
- The pilot rank and number of points earned after subtracting penalties from the average score given by the judges.
- Shows the maximum number of points possible for the flight, and the percentage of maximum possible points earned by the pilot.
- These are the same numbers shown for the flight program overall based on the results for all pilots on the same flight program. The numbers shown match the numbers shown in the flight report. See the judge metrics explanations for further notes about these numbers.
Judge metrics
The judge metrics include three measures of how closely each judge ranked pilots relative to the overall ranking of pilots. The measures use pilot scores and rankings before penalties. Judges do not apply penalties. Penalties sometimes alter the final rankings of the pilots.
- rho (ρ)
- is the full computation of the Spearman Rank Corelation Coefficent
formulated as follows, multiplied by 100.
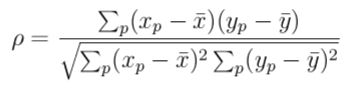
rho ranges from -100 to 100. 100 means the judge ranked the pilots exactly the same as the result ranking. Zero means the judge's rankings are more or less random relative to the result ranking. Negative values mean the judge ranked the pilots more or less opposite the overall ranking-- more if the value is more negative. Negative 100 means the judge ranked the pilots exactly opposite the result ranking. This sometimes happens when there are only two pilots.
Contest values, category rollups, and career rollups track the three separate sums from all flights judged.
- ri
- is the CIVA computation that scales differences in the judge score and
overall score by the difference in rank. The formula is:

A zero RI represents perfect agreement in the rankings. Larger numbers are worse. Find more information about RI in the FAI Sporting Code, Section 6: Aerobatics, referenced below. The RI discussion begins at paragraph 8.8.1.
Contest values, category rollups, and career rollups use the average RI value from all flight programs. This procedure differs from that used for rho and gamma because RI contains a scaling adjustment for the number of pilots in the flight program. The scaling starts to dominate the value when there are more than fifty or sixty pilots.
- gamma (γ)
-
is the Goodman and Kruskal gamma correlation coefficient
multiplied by 100.
The formula is:
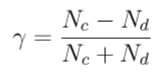

The formula uses counts of differences in paired rankings. If the overall ranking and the individual judge ranking both place pilot A before pilot B, that is a "concordant pair." A "discordant pair" arises when the overall ranking places pilot B before while the judge places pilot A before, or vice-versa.
Gamma ranges from -100 to 100. 100 is a perfect correlation. Zero means the judge's rankings are more or less random. Negative values mean the judge ranked the pilots more or less opposite the overall ranking. More if the value is more negative.
Contest values, category rollups, and career rollups track the total of concordant and discordant pairs from all flight programs.
- Np
- The number of pilot flights, counts one for every pilot every time they fly a flight program
- Npp
- The number of pilot pairs. A flight with six pilots has Np(Np - 1)/2 = 15 pairs.
- Nf
- The number of flight programs
- Fza
- The average number of pilots in a flight program
- Ng
- The number of grades given
- Ka
- The average K for a figure graded
- Mz
- The number of minority zero grades
- Mg
- The number of minority grades
Judge experience
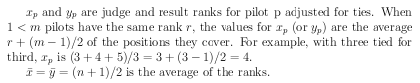
To rank judges in the judge experience pages we use a non-normalized variant of the Goodman and Kruskal gamma correlation coefficient (γ). That is the top half of the gamma formula, N_c - N_d: the number of pilot pairs ranked in accordance with the result ranking minus the number of pilot pairs ranked opposite the result ranking.
Because judges who judge a lot get more or less the same proportion of pilot pairs ranked in accordance with the results, you'll see a strong correlation with the number of pilot pairs (Npp).
Given normal gamma, the ranking places judges first who have judged more and larger flight programs. That is, judges with more experience.